Climate Accounts
UiO aims to halve carbon emissions by 2030. Have a look at our progress within different categories.
Our goals for 2030

Travel
50% cuts in emissions from business trips

Energy consumption
30% lower energy use on campus

Buildings
Sustainable maintenance and climate friendly construction

Goods
Lower, more sustainable consumption
UiO uses 2018 as a reference year.

Services
Lower, more sustainable consumption

Waste
Waste less, recycle more
Our progress 2018–2030
The climate accounts are a helpful tool to identify which of our activities contribute the most to carbon emissions. This helps us implement the most effective measures possible to reduce our emissions. The overview shows which categories have the highest emissions and how we are progressing towards our goals.
Total emissions

This graph shows the total emissions at UiO in the period 2018-2025. Our goal of halving the emissions by 2030 is marked by a dotted line.
In 2025, we have reduced our emissions by 27 percent compared to 2018.
Travel

UiO aims to halve the emissions from business trips from 2018-2030. This includes trips made by our employees for conferences, fieldwork, and other international collaborations. The dotted line indicates the goal. The graph shows emissions from air travel, which makes up 94 percent of all emissions in the category “transport and travel”.
In 2025, there was a significant reduction in the scope of domestic, Nordic and intercontinental flights. The carbon emissions from air travel have been reduced by 36 percent sine 2018, of which 10 percent of this reduction was achieved from 2024 to 2025.
Energy consumption

Energy consumption represents the emissions associated with purchased electricity and district heating in both owned and rented properties. UiO aims to reduce on-campus energy use by 30 percent by 2030, as indicated by the dotted line on the graph.
Energy consumption was the largest source of emissions in 2025, accounting for 31 percent of the total emissions. Since 2018, we have reduced the emissions by approximately 21 percent. The large reductions in 2025 were mainly due to reduced use of district heating, due to higher-than-normal temperatures during the heating season.
However, energy consumption is expected to rise in the coming years, as a result of moving into the Life Science Building.
Buildings

This category consists of emissions resulting from investments made in buildings and real estate, related to activities such as management, maintenance, leasing, and upgrades. The climate accounts include both owned and rented properties.
The emissions from buildings were reduced by eight percent compared to 2018.
Waste
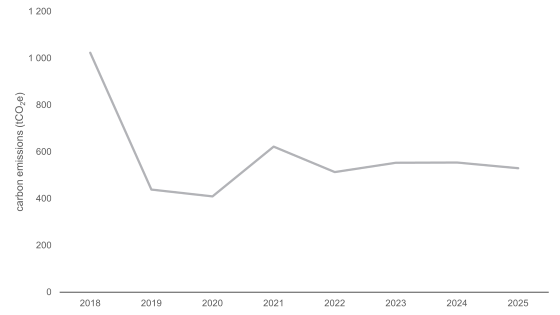
The waste category shows the carbon emissions for all waste generated by UiO. UiO aims to waste less and recycle more. In 2025, waste accounted for just one percent of our total carbon emissions.
The emissions from waste have been reduced by 48 percent since 2018. In 2025, 67 percent of the waste generated was recycled.
Services
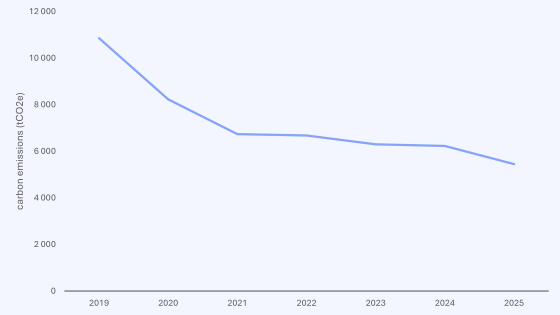
Services show indirect emissions related to the provision of services purchased by UiO. The category covers a wide range, from consultancy fees to catering services, as well as various operational services.
There was a significant reduction in 2025 compared to the year before, with emissions decreasing by 13 percent. This is mainly due to less use of consultants, as well as developments in the emission factors for the services purchased.
Goods
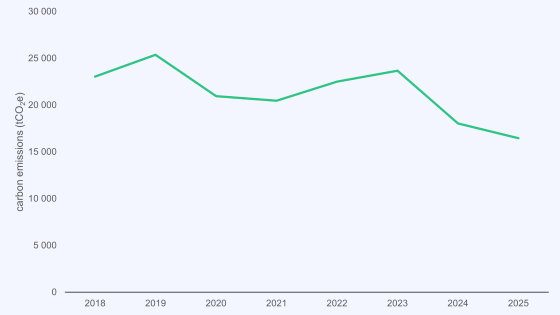
This category includes all purchases of goods made at UiO in 2025, ranging from equipment and machinery to supplies and IT equipment. Purchased goods accounted for 23 percent of the total emissions.
In 2025, we reduced our emissions from the purchase of goods by nine percents compared with 2024. The reduction is mainly due to price adjustments and the fact that goods are increasingly produced and transported in more climate friendly ways.
Sources of emissions in 2025

Sources of carbon emissions per category at UiO in 2025:
- Energy consumption: 31 percent
- Goods: 23 percent
- Travel: 21 percent
- Buildings: 16 percent
- Services: 8 percent
- Waste: 1 percent
- Direct emissions: less than one percent
The diagram displays approximate values, with percentages rounded to the nearest whole value.
Methodology
About the methodology
The climate account has been made using the tool Klimakost, developed by Asplan Viak. The same tool is used by the University of Bergen, NTNU, the national network Klimapartnere and several municipalities.
Klimakost makes it possible to compile data from various emission sources in the organisation and calculates carbon emissions based on the data available to the organisation. The data in this report is based on a combination of physical and economic values.
In 2022, a more extensive adjustment was made to the emission intensities and the categories “Goods” and “Services” in Klimakost, with effect from 2021 onwards. Consequently, results from these two categories are not directly comparable with the 2018 level.
Although there is some uncertainty associated with specific calculations, the climate account provides a good basis for identifying trends and the direction of our efforts.
About travel
The data for the category Transport and travel is linked to physical data for air travel, using kilometres travelled by the passenger (pkm), obtained from UiO’s travel agency. In addition, data have been obtained for journeys booked outside the travel agency agreement.
In the reports for 2018 and 2019, emissions from travel booked outside the travel portal were not included in the data material, which in later years has led to weaker comparability. In 2022, UiO adjusted the figures for air travel in 2018 accordingly.
In 2018, emissions from air travel booked through the travel agency amounted to 13,956 tonnes of CO2-equivalents. The proportion of flights booked outside of the travel portal was approximately 35 percent, based on the climate account reports from 2021 and 2022, and it was assumed to have remained stable since 2018.
By doing a recalculation, a more accurate basis for comparison between current data and the reference year is ensured, thus resulting in a better understanding of how we are progressing in relation to the goal of a 50 percent reduction.
The adjustment has been incorporated into Klimakost to ensure that the updated figures are included in the annual climate accounts.
Previous reports
Klimagassregnskap 2018 (pdf, 1003 kb)
Klimagassregnskap 2019 (pdf, 1017 kb)
Klimagassregnskap 2020 (pdf, 1298 kb)
Klimagassregnskap 2021 (pdf, 1111 kb)
Klimagassregnskap 2022 (pdf, 804 kb)
Klimagassregnskap 20223 (pdf, 1200kb)
Klimagassregnskap 2024 (pdf, 1900kb)
Read the report for the climate accounts in 2025 (pdf, 2140 kb) - Norwegian only