Nettsider med emneord «Matlab»

Publisert 29. nov. 2020 20:46
The plots generated from Championship data reveal a lot about your micromotion. What do the graphs tell? Here we explain.
Publisert 31. aug. 2020 21:12
The plots generated from Championship data reveal a lot about your micromotion. What do the graphs tell? Here we explain.

Publisert 31. aug. 2012 12:17
Mocapgrams are helpful tools for visualising a longer segment of mocap data. They allow easy visualisation of recurring patterns and periodicities in the mocapdata, and interconnectivity between markers.
Publisert 3. aug. 2012 21:43
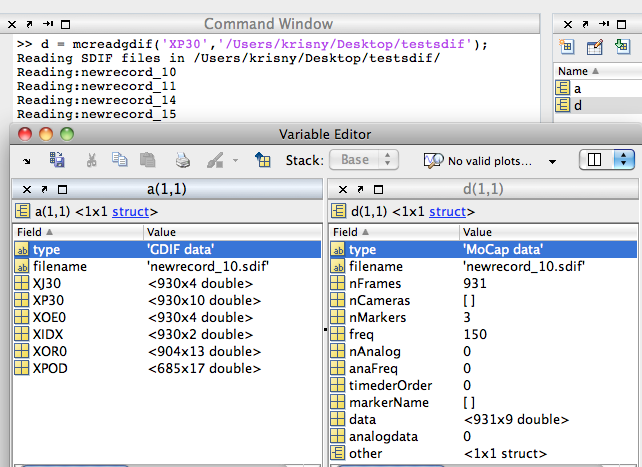
Two scripts for reading GDIF data from SDIF files into Matlab.
Publisert 10. juli 2012 09:10
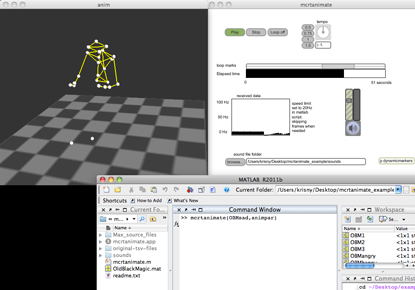
This software enables realtime streaming of mocap data from the MoCap toolbox for Matlab, synchronised with audio.