Video recording is one of the most accessible “motion capture” technologies. Video cameras are readily available everywhere so that anyone can get started immediately.
It may be odd to think that creating visualisations of a video recording is necessary. After all, video is already a visual representation. However, watching a running video is inefficient in analysing long video recordings.
Average image
An average image is the weighted sum of all frames in a video file. It is similar to an "open shutter" technique in analogue photography. Average images typically look blurred. They may help understand the spatial content of a video file.
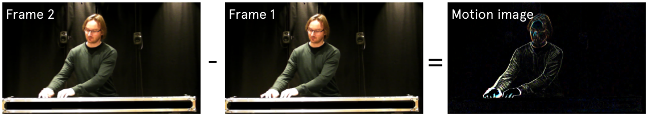
Motion image
One of the most common techniques when working with motion analysis from video files is creating a motion image. The motion image is found by calculating the absolute pixel difference between subsequent frames in a video file, as illustrated in the figure below. The result is an image in which only the pixels that have changed between the frames are displayed.
The quality of the raw motion image depends on the quality of the original video stream. Small changes in lighting, camera motion, compression artefacts, and so on can influence the final image. Such visual interference can be eliminated using a simple low-pass filter to remove pixels below a certain threshold or a more advanced “noise reduction” filter, as illustrated below. Either tool cleans up the image, leaving only the most salient parts of the activity in motion.

The filtered motion image video is usually the starting point for further processing and analysing the video material.
Motion Average Image
A motion average image is similar to an average image, but created from a motion image. It looks blurred but gives an idea about the spatial distribution of the content.
Motion-history image
A motion image represents the motion between two frames but does not represent a motion sequence that takes place over more frames. To visualise the motion over time, it is necessary to create a motion-history image. This display keeps track of the history of what has happened over some recent frames. One approach is to average over all the frames in the recording. This produces what could be called an average image or a motion-average image, such as shown below.

These images may or may not be interesting to look at, depending on the duration of the recording and the motion content. The examples above are from a short recording that includes only one short passage and a raising of the right hand. The lift is very clearly represented in the motion-average image. In contrast, the average image mainly indicates that the main part of the body itself stayed more or less in the same place throughout the recording.
For longer recordings, with more activity in larger parts of the image, the average images tend to be more “blurred”—indicating how the motion is distributed in space.
It is possible to combine the average and motion-average images to make the motion-history image easier to look at. An alternative is to add one frame (for example, the last frame) to the motion-average image. This makes it possible to combine a clear picture of the person in the frame with traces of the motion history, as illustrated below.

Motion history images may be used to study, for example, performance technique. The figure below shows a visualisation of a percussion study. Here, each image represents an individual stroke on the drum pad. The image series serves as a compact and efficient visualisation of fourteen different strokes by the percussionist.

Each of the displays in the figure above represents around fifteen seconds of video material. As such, this figure is a very compact representation of a full recording session.
Motiongrams
The motion-history images above reveal information about a motion sequence’s spatial aspects, but there is no information about the motion’s temporal unfolding. Then a motiongram may be useful since it displays motion over time. A motiongram is created by averaging over a motion image, as illustrated in the figure below.

This figure shows a schematic overview of the creation of motiongrams, based on a short recording of piano performance. The horizontal motiongram clearly reveals the lifting of the hands and some swaying in the body’s upper part. The vertical motiongram reveals the hands’ motion along with the keyboard, here seen from the front, as in the previous figures.
One example of how motiongrams can be used to study dance performance can be seen below. This display shows motion-average images and motiongrams of forty seconds of dance improvisation by three different dancers moving to the same musical material (approx. forty seconds). A spectrogram of the musical sound is displayed below the motiongrams.

The motiongrams reveal spatiotemporal information that is not possible to convey using keyframe images. They facilitate the researcher’s ability to follow the trajectories of the hands and heads of the dancers throughout the sequences.
For example, the first dancer used quite similar motions for the three repeated excerpts in the sequence: a large, slow upwards motion in the arms, followed by a bounce. On the other hand, the third dancer had more varied motions and covered the whole vertical plane with the arms. Such structural differences and similarities can be identified in the motiongrams and then studied in more detail in the original video files.
Videogram
A videogram is similar to a motiongram but created from the original image instead of the motion image. The result is a spatiotemporal representation of the content of the video that works well for material with scene shifts and camera motion.